Published
- 5 min read
Setup OTel Collector Using opentelemetry-kube-stack Chart
Introduction
About 8 weeks ago I’ve completely rebuilt my Kubernetes cluster with one that is powered by Talos Linux and the goal with the new cluster is to have everything fully managed through GitOps (ArgoCD).
Furthermore, I wanted to enhance and simplify the cluster’s Observability by using OTel Collector. I also discovered that NewRelic has an awesome free tier that comes with many great features! The only catch is that data retention is only for 8 days.
This is more than enough for me to track metrics, but for logs I wanted a longer retention, so I’ve also implemented VictoriaLogs to store them locally for a longer retention period.
Architecture
Here is a high level architecture of my OTel Stack.
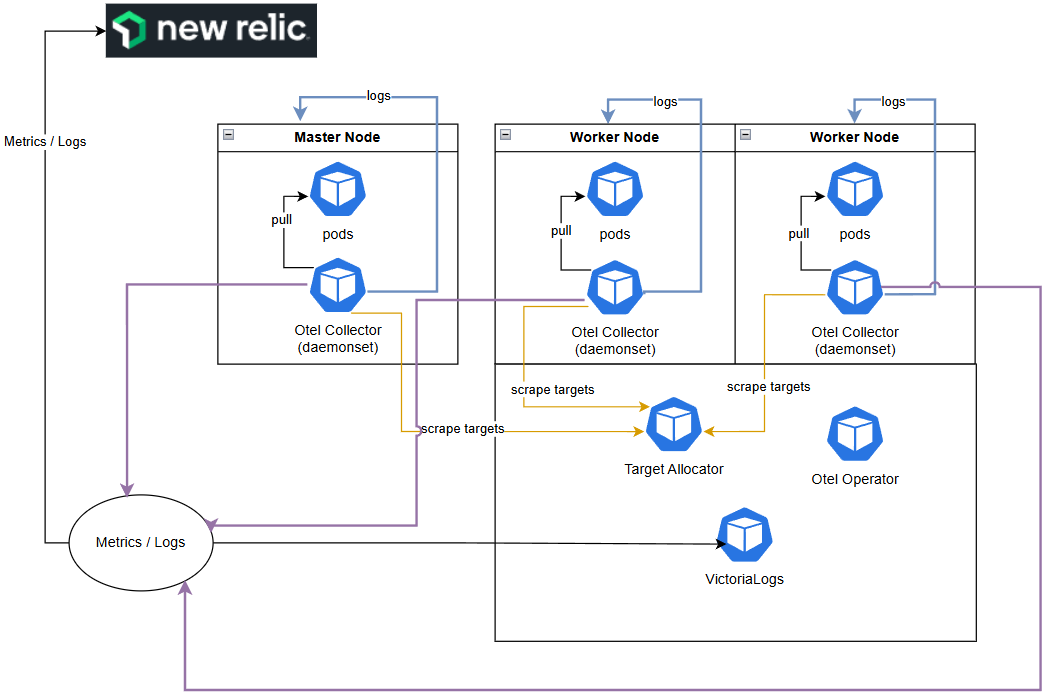
Important: Since I am using daemonset, the OTel Collectors will always pull from pods within its own node. When using modes such as deployment or statefulset, the TargetAllocator can allow the collectors to pull metrics from all different pods across the different nodes.
The reason I’ve chosen to use daemon set is because I also wanted to collect pod logs from every node. There is also nothing wrong with deploying multiple collectors and using different mode for each. The opentelemetry-kube-stack chart supports this functionality very well.
Why OpenTelemetry (OTel) Collector?
OTel provides a standardized & vendor-neutral approach to collecting metrics, logs, and traces across distributed systems.
This makes it easy to unify observability without being locked into a single vendor or toolchain.
The ability to setup custom pipelines in OTel to process telemetry data and custom exporters, it makes it extremely flexible to target different endpoints such as NewRelic, Datadog etc.
Why NewRelic?
The main reason I chose NewRelic is due to their generous free tier & the capability that also comes with it.
I can push metrics, logs, traces, create dashboards and setup alerts all within the free tier.
The only catch for me the limit of 100 GB/month of ingested data & the 8 day retention limit. However this is not an issue for a home lab setup.
Why VictorLogs?
Due to the 8 day retention limit of NewRelic’s free tier, I wanted to retain logs for a much longer period, so I’ve setup VictoriaLogs to run locally just for storing logs.
I’ve chosen VictoriaLogs based on:
- Ease of install
- Uses much less memory & disk space then Loki
- Higher performance
- Built-in UI (without needing any other toolchain) for quering logs
Also, since OTel Collector allows me to configure my own custom pipelines and use different/multiple exporters, I’ve taken advantage of this capability to send logs to both NewRelic and VictoriaLogs.
As not all pod logs are important for me, OTel Collector allows me to run specific processors to filter only the logs I want to retain locally & thus few IO and enables a longer lifespan of my storage devices.
Installing opentelemetry-kube-stack Chart
The reason I’ve chosen to install OTel Collector by using the opentelemtry-kube-stack is because it’s very powerful! To setup OTel Collector manually it requires a fair amount of effort.
The kube-stack chart is perfect for those looking to install OTel on Kubernetes. At a high level, the chart provides you with the following:
- Installs the OTel Collector Operator & CRDs.
- Deploying multiple collectors and using different modes (e.g. a mix of daemonset + statefulset collectors)
- High Availablility with HPA (when not running as daemonset).
- Setup Target Allocators to efficiently distribute Prometheus scrape targets across multiple collectors.
- Custom Role required for scraping pods without having to craft your own permissions.
- Built-in presets to quickly and easily start collecting metrics, logs, events etc.
- Ability to pass in custom manifest as
extraObjects.
The values passing into the Helm Chart is fairly large, but the source is available on my GitHub repo.
The initial setup is through local Helm install for rapid development (instructions in the repo README), all subsequence and future updates are managed through ArgoCD. The following is what I have configured in the Argo App.
       apiVersion: argoproj.io/v1alpha1
kind: Application
metadata:
  name: otel-collector
  namespace: argocd
spec:
  project: default
  sources:
    - repoURL: https://open-telemetry.github.io/opentelemetry-helm-charts
      chart: opentelemetry-kube-stack
      targetRevision: "0.11.0"
      helm:
        releaseName: otel
        valueFiles:
          - $values/infra/charts/observability/otel-collector/values.yaml
    - repoURL: https://github.com/88lexd/website-astro
      targetRevision: HEAD
      ref: values
  destination:
    server: https://kubernetes.default.svc
    namespace: monitoring
Installing VictoriaLogs Cluster
VictorLogs can be installed as a standalone or as a cluster. I’ve chosen the cluster mode to demonstrate the ability to setup VictoriaLogs with High Availablity and with horizontal scaling capability.
VictoriaLogs in cluster mode is composed of three main components: vlinsert, vlselect, and vlstorage.
To install, I’ve chosen to use Helm Chart and you can see the values and README on my GitHub repo
Same as the OTel Collector, all things in my cluster is managed through GitOps, so I have the following ArgoCD App to manage VictoriaLogs.
       apiVersion: argoproj.io/v1alpha1
kind: Application
metadata:
  name: victoria-logs
  namespace: argocd
spec:
  project: default
  sources:
    - repoURL: https://victoriametrics.github.io/helm-charts
      chart: victoria-logs-cluster
      targetRevision: 0.0.13
      helm:
        releaseName: vlc
        valueFiles:
          - $values/infra/charts/observability/victoria-logs-cluster/values.yaml
    - repoURL: https://github.com/88lexd/website-astro
      targetRevision: HEAD
      ref: values
  destination:
    server: https://kubernetes.default.svc
    namespace: monitoring
What’s Next?
I have the following planned but I am not sure when I get to do this, it has been so hard to find time now that I am a father of 2.
- Using IaC; Setup NewRelic Dashboards, Alerts & Synthetics Monitoring
- Write a post on Argo CD and how I’m achieving App of Apps
- Write a post on Talos Linux and how I’ve set it up
Most of the ArgoCD work is already done, so if you are interested it is available on my GitHub repo under the infra directory.